- Home
- About
- Partners
- Newcastle University
- University of L'Aquila
- University of Manchester
- Alacris Teranostics GmbH
- University of Pavia
- Polygene
- Consiglio Nazionale delle Ricerche
- INSERM
- Certus Technology
- Charité Universitaet Medizin
- GATC Biotech
- University Medical Center Hamburg Eppendorf
- Evercyte GmbH
- University Hospital of Cologne
- PRIMM Srl
- University of Freiburg
- University of Antwerp
- Finovatis
- Research
- SYBIL at a glance
- Bone
- Growth plate
- Desbuquois dysplasia
- Diastrophic dysplasia
- MCDS
- Osteopetrosis
- Osteoporosis
- Osteogenesis imperfecta
- Prolidase deficiency
- PSACH and MED
- Systems biology
- SOPs
- Alcian Blue staining
- Bone measurements
- BrdU labelling
- Cell counting using ImageJ
- Chondrocyte extraction
- Cre genotyping protocol
- DMMB assay for sulphated proteoglycans
- Densitometry using ImageJ
- Double immunofluorescence
- Electron microscopy of cartilage - sample prep
- Extracting DNA for genotyping
- Grip strength measurement
- Histomorphometry on unon-decalcified bone samples
- Immunocytochemistry
- Immunofluorescence
- Immunohistochemistry
- Quantitative X-ray imaging on bones using Faxitron and ImageJ
- Skeletal preps
- TUNEL assay (Dead End Fluorimetric Kit, Promega)
- Toluidine Blue staining
- Toluidine Blue staining
- Von Kossa Gieson staining
- Wax embedding of cartilage tissue
- Contact Us
- News & Events
- Links
- Portal
BrdU labelling
Sample preparation
- inject animals with 0.1ml BrdU labelling reagent per 10g weight at 3 weeks of age
- sacrifice after 2h of labelling and dissect theknee samples
- fix samples in 95%EtOH 5%HAc over 48h in the fridge
- decalcify samples in 20% EDTA pH7.4 for 2 weeks
- wax embed and section (6um sections)
Note
in order to generate statistically robust data, use 3 animals per genotype, 3 sections per animal (from different anatomically matched regions in the knee), 3 sections per slide.
Staining steps
dewax in xylene 2 x 5min
. ↓
100% EtOH 3min
. ↓
90% EtOH 3min
. ↓
70% EtOH 3min
. ↓
50% EtOH 3min
. ↓
1x PBS (rocker) 3 x 5min (from here on, do not let the sections dry!)
. ↓
4M HCl (12.3ml conc HCl in 100ml) in glass pot 15min
. ↓
0.1M borate buffer (5x: pH8.5, 30.9g boric acid + 13.5ml 10M NaOH, to 1l with H2O) 5min
. ↓
1x PBS (rocker) 3 x 2min
. ↓
10ml 30% H2O2 in 100ml dH2O 5min
. ↓
1x PBS (rocker) 3 x 2min
. ↓
draw ImmEdge circles around sections
keep the slides in a humidified chamber during all incubations
. ↓
block in 40ul goat serum Dako + 960ul 1x PBS 20min
. ↓
1ºAb (1:100) in 1x PBS (Abcam monoclonal rat anti BrdU ab6326) 1h
. ↓
1x PBS (rocker) 2 x 5min
. ↓
prepare ABC reagent (2.5ml PBS+dropA+dropB, 30min before use)
. ↓
2ºAb (1:200) in 1x PBS (goat anti-rat Abcam ab6844) 20min
. ↓
1x PBS (rocker) 2 x 5min
. ↓
ABC reagent 25min
. ↓
1x PBS (rocker) 2 x 5min
. ↓
DAB (1ml buffer+dropDAB) quench in PBS 1-10min
. ↓
methylene green 10min
. ↓
3x tap water 5min
. ↓
95% EtOH 3min
. ↓
100% EtOH 5min
. ↓
xylene 2 x 5min
. ↓
mount in Vectamount, dry overnight
Data analysis
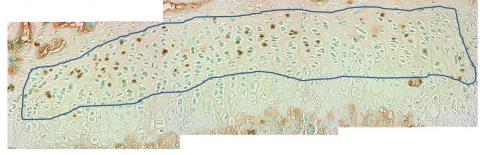
- count BrdU positive cells (brown) in the proliferative zone and present them as a percentage of all cells (green and brown) in this zone.
- use One Way ANOVA to statistically analyse the data.
Example: